Large HSC dataset released to the public
The first dataset from the Hyper Suprime-Cam Subaru Strategic Plan (HSC-SSP) was released to the public in February 2017. HSC-SSP is an extensive survey program started in 2014 to observe for 300 nights with HSC in collaboration with the Kavli Institute for the Physics and Mathematics of the Universe (Kavli IPMU) in Japan, the Academia Sinica Institute of Astronomy and Astrophysics (ASIAA) in Taiwan, and Princeton University in the United States. The release includes data from the first 21 months, corresponding to 61.5 nights of observations.
- HSC-SSP Website
- Subaru Telescope Topics "First Public Data Release by the Hyper Suprime-Cam Subaru Strategic Program"(February 2017)
Survey area
The HSC-SSP survey consists of three layers; Wide, Deep, and UltraDeep. The Wide layer fields cover wide areas; the Deep layer fields cover narrower areas than the Wide fields but are observed more deeply; the UltraDeep layer fields are observed even more deeply than the Deep fields. Deeper observations need longer exposure times and enable us to see fainter objects. For the UltraDeep layer, the exposure times are more than 40 times longer than those used for the Wide layer. For this reason, the UltraDeep fields can’t cover as wide an area of the sky as Wide fields. In other words, the Wide fields cover the widest areas with the shortest exposure times, and the UltraDeep fields contain the deepest data with the longest exposure times, covering the narrowest portions of the sky.
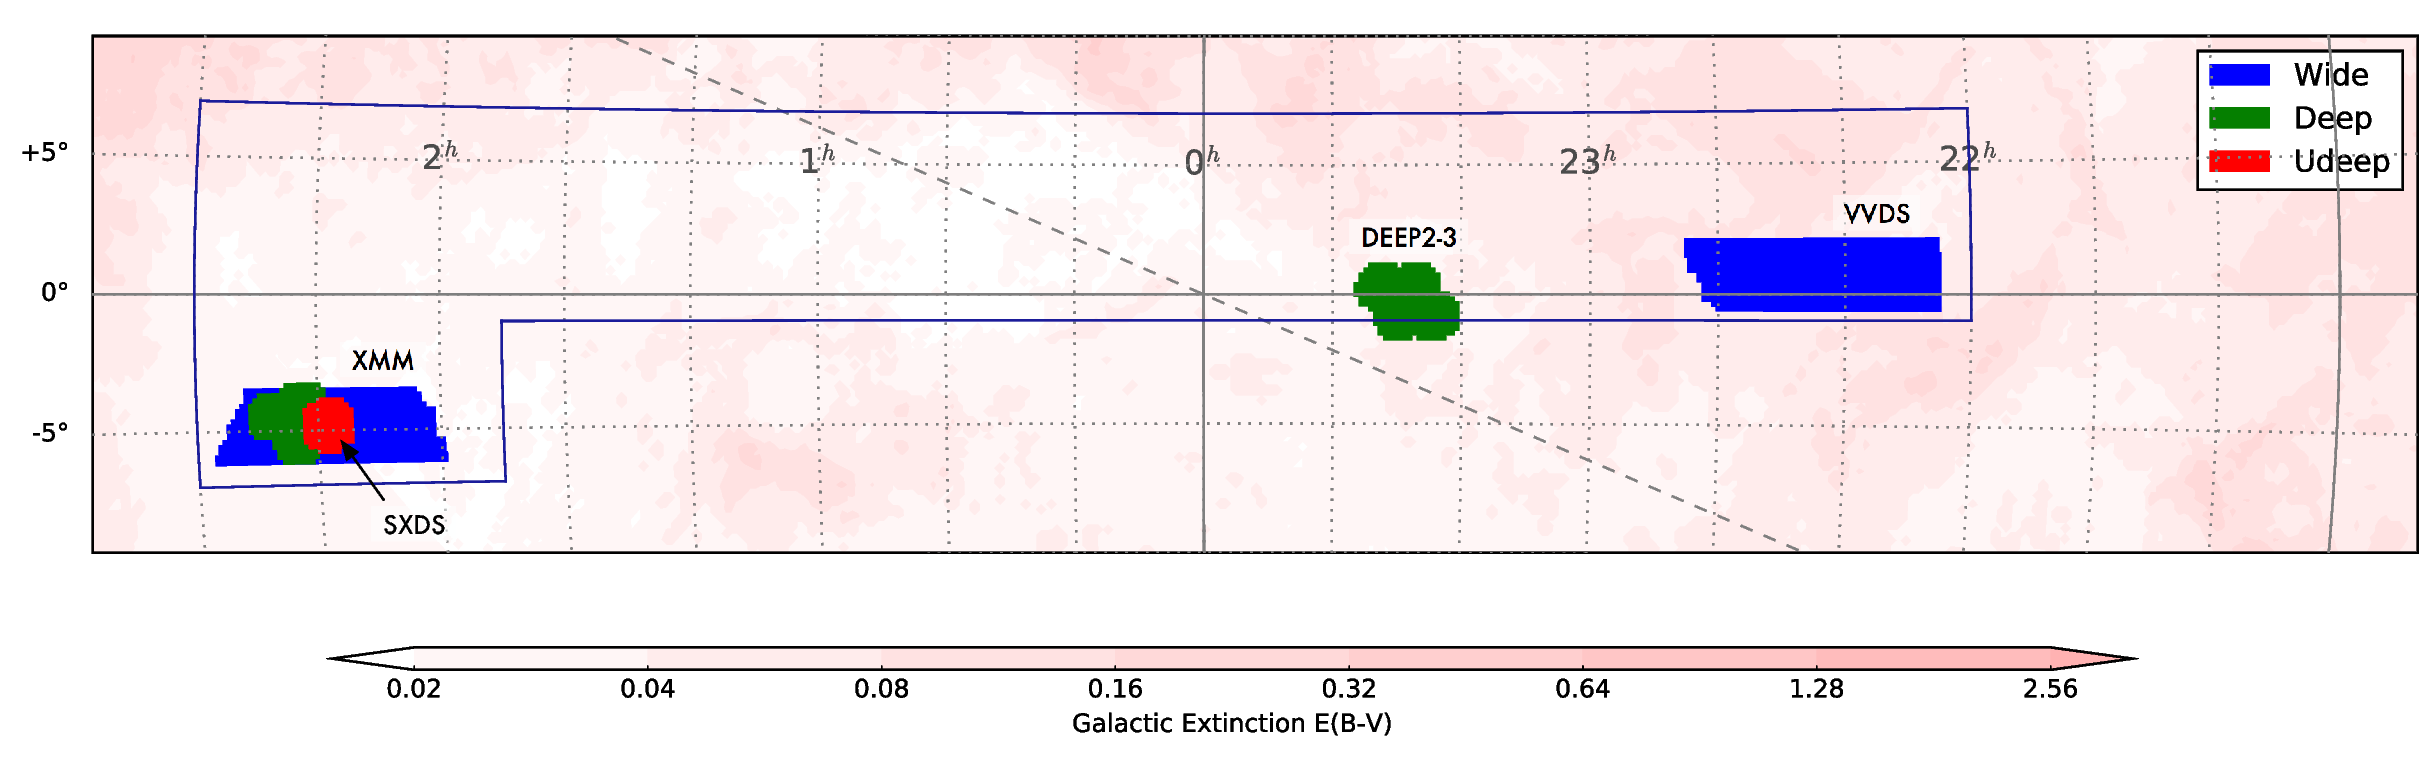
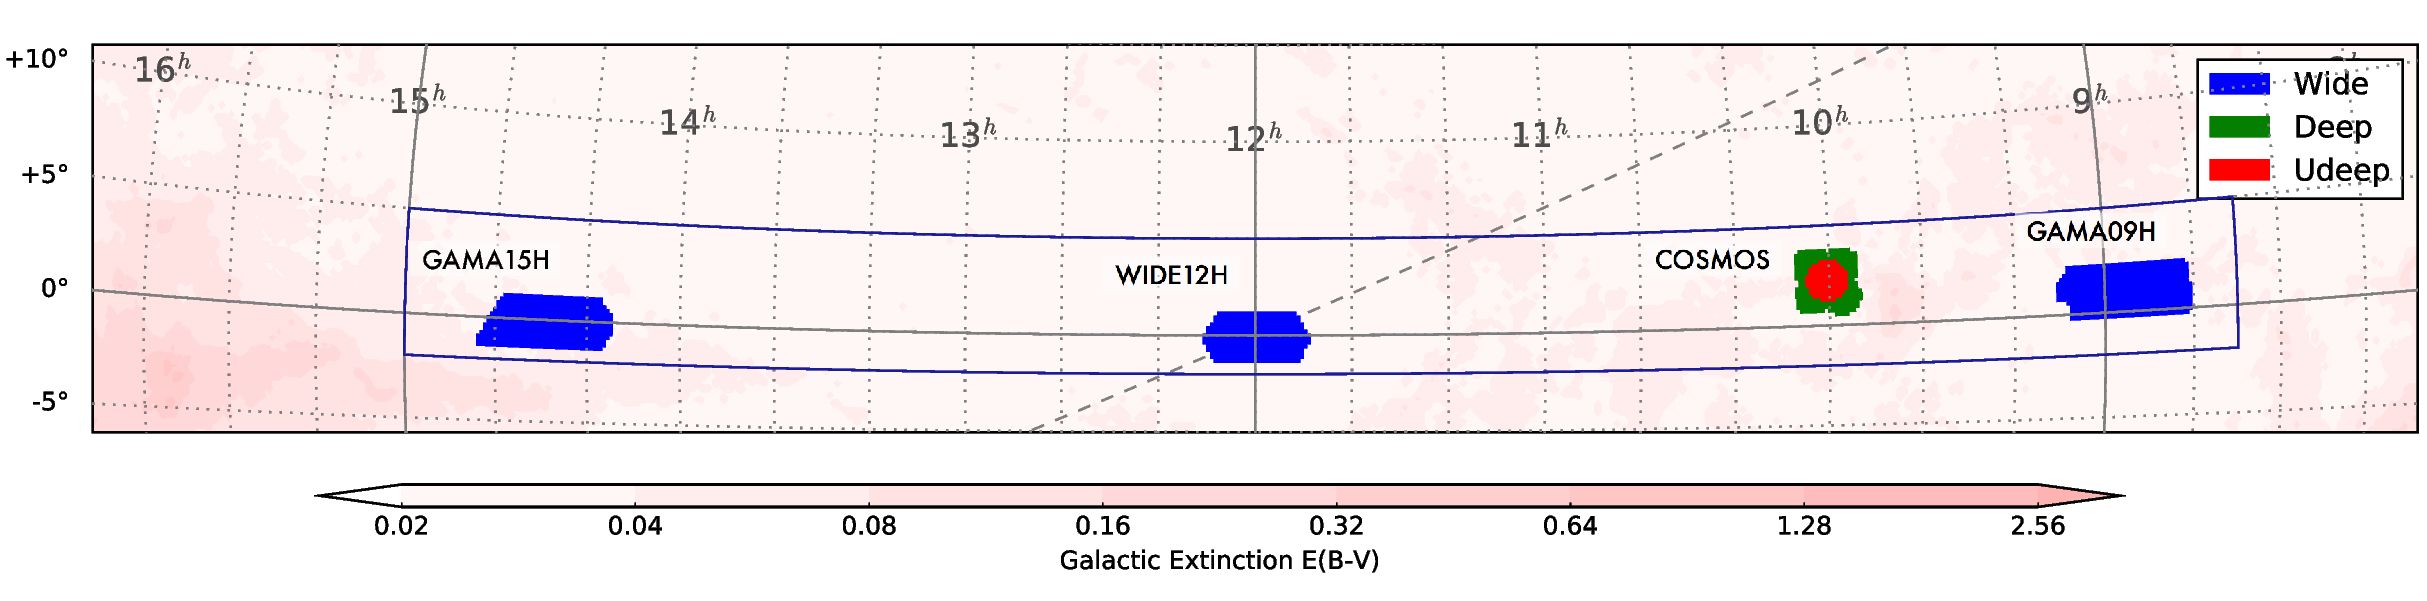
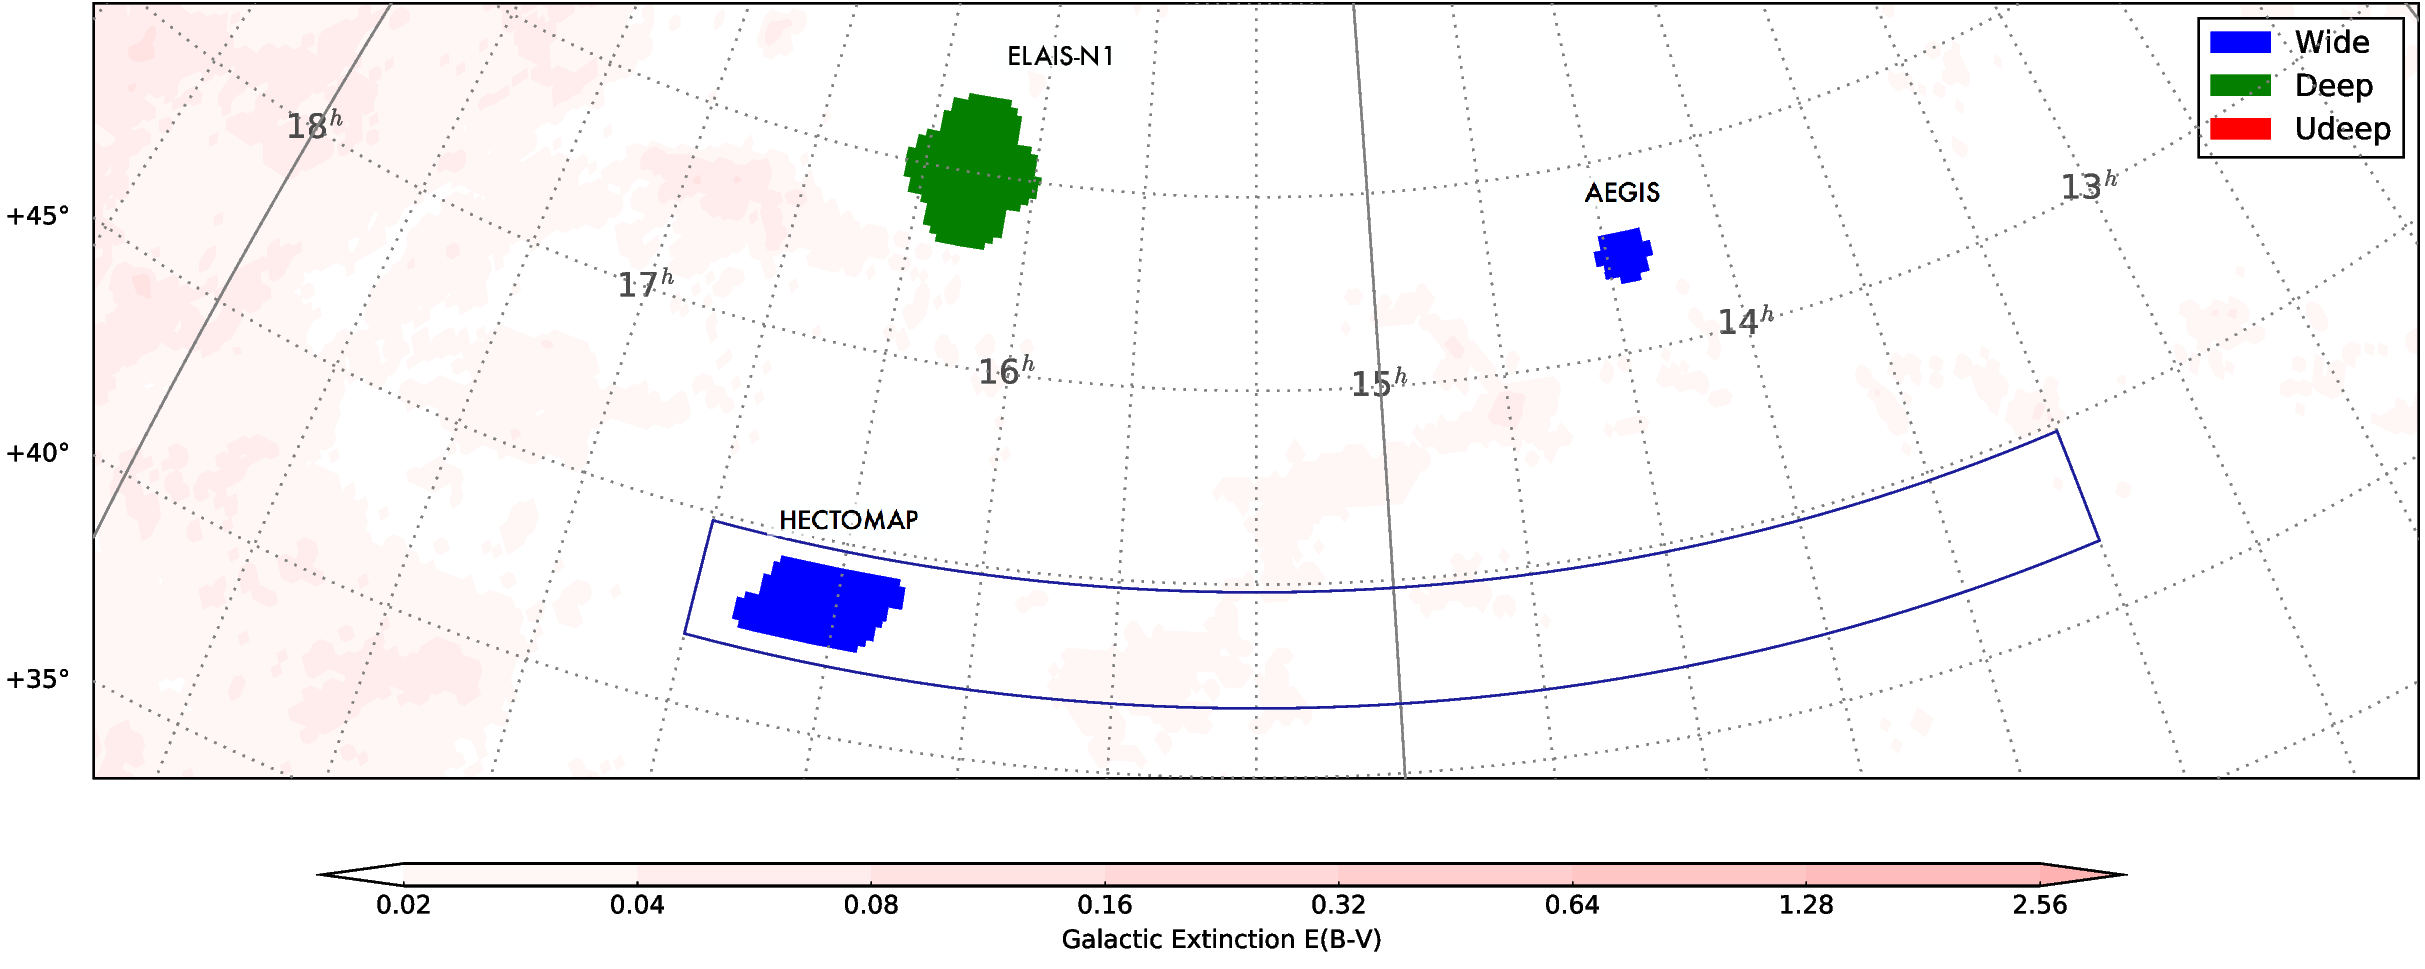
Fig. 1 Survey area of HSC-SSP. Blue, green, and red show the areas of the Wide, Deep, and UltraDeep fields, respectively, for the first public data release. The solid blue lines indicate the final goals of the Wide layer. In this sky chart, the observed areas are shown in the equatorial coordinate system*), and the horizontal and vertical axes show right ascension and declination, respectively. The pink background color shows light extinction (absorption of light). The areas of stronger pink color have stronger interstellar extinction. The selected observation fields were chosen because they have weak light extinction, and other observational data exist for comparison. (Credit: NAOJ/HSC Project)
(top) Observed fields in the autumn constellations around right ascension (RA) = 0 h and declination (Dec) = 0°, which corresponds to the constellation Pisces. All fields are located close to the celestial equator.
(middle) Observed fields in the spring constellations around right ascension (RA) = 12 h and declination (Dec) = 0°, which corresponds to the constellation Virgo. All fields are located close to the celestial equator.
(bottom) Observed fields in the northern sky, far from the celestial equator (Dec = 0 °).
*) The equatorial coordinate system is a virtual sphere around the Earth (celestial sphere); the center of the sphere is defined to be at the center of the Earth. The celestial north pole (Dec = +90°), south pole (Dec = -90°), and equator are projections of Earth's north pole, south pole, and equator on to the celestial sphere. Right ascension measures the angular distance of an object eastward along the celestial equator from the vernal equinox in units of hours, minutes, and seconds. The full circle runs from 0 h to 24 h. (The vernal equinox and the celestial equator change with time. Currently, their positions as of the vernal equinox of year 2000 A.D. (J2000.0) are commonly used as the reference system.)
The HSC-SSP fields are mainly located in spring and autumn constellations. In these fields, it is easy to observe distant galaxies and objects far from the Milky Way Galaxy in which we live. The Deep and UltraDeep fields have many data (mainly spectroscopic data) taken with other telescopes available for comparison. The four Deep fields are separated from each other so that scientists can observe one of the four fields in any season. Please see the summary of the fields in Table 1.
| Field | Layer | Constellation | Note | |
|---|---|---|---|---|
| Fig. 1 top | XMM | Deep & Wide | Cetus | Fields observed with the European XMM-Newton, an X-ray space telescope. |
| Fig. 1 top | SXDS | Udeep | Cetus | The Subaru/XMM-Newton Deep Survey field. |
| Fig. 1 top | DEEP2-3 | Deep | Pisces | Field observed as the DEEP2 survey with the American Keck Telescopes. |
| Fig. 1 top | VVDS | Wide | Aquarius | A field observed as VVDS with the European VLT in Chile. |
| Fig. 1 middle | GAMA15H | Wide | Virgo | Field around RA = 15 h observed as the GAMA project with the Anglo-Australian Telescope in Australia. |
| Fig. 1 middle | WIDE12H | Wide | Virgo | Wide field around RA = 12 h (GAMA project data available). |
| Fig. 1 middle | COSMOS | Udeep & Deep | Sextans | Field observed as the COSMOS project with the Hubble Space Telescope (HST) and many other telescopes including the Subaru Telescope. |
| Fig. 1 middle | GAMA09H | Wide | Hydra | Field around RA = 9 h observed as part of the GAMA project. |
| Fig. 1 bottom | HECTOMAP | Wide | Hercules | Field observed as the HectoMAP survey with MMT of the University of Arizona, USA. |
| Fig. 1 bottom | ELAIS-N1 | Deep | Draco | Survey field in collaboration with 19 European institutions. |
| Fig. 1 bottom | AEGIS | Wide | Auriga | Field observed for calibrations. This field has a variety of spectroscopic data from various telescopes including the DEEP2 survey. |
Filters and limiting magnitudes (detail information)
Each field is observed at specific wavelengths by using filters. A filter transmits only a certain band of wavelengths. There are two kinds of filters; general purpose broad-band filters with about 1,500 angstroms (Å) passband, and narrow-band filters with about 100 Å passband which transmit only a specific spectral line. For the HSC-SSP survey, five broad-band filters and four narrow-band filters are used in each field. The filters and their limiting magnitudes for each layer are listed in Table 2. Limiting magnitude is the faintest apparent magnitude of celestial bodies which can be found in the observation data. A larger number for the limiting magnitude means that fainter objects can be detected. In Table 2, the UltraDeep fields have the largest number for the limiting magnitude, thus can detect the faintest objects. Seeing, the sharpness of a stellar image, is very good: 0.6 - 0.8 arcseconds (1 arcsecond corresponds to 1/3600 degree), which makes the data high-quality.
| Filter*) | g | r | i | z | y | NB816 | NB921 |
|---|---|---|---|---|---|---|---|
| Effective Wavelength (Å) (Empirically measured) | 4740 green | 6170 red | 7650 infrared | 8890 infrared | 9760 infrared |
8180 infrared | 9210 infrared |
| broad/narrow band | broad | broad | broad | broad | broad | narrow | narrow |
| Wide Fields Limiting Magnitude**) | 26.8 | 26.4 | 26.4 | 25.5 | 24.7 | - | - |
| Deep Fields Limiting Magnitude**) | 26.8 | 26.6 | 26.5 | 25.6 | 24.8 | 25.9 | 25.6 |
| UltraDeep Fields Limiting Magnitude**) | 27.4 | 27.3 | 27.0 | 26.4 | 25.6 | 26.3 | 25.8 |
**) Limiting magnitudes of the first released dataset. The final goals for limiting magnitudes are listed in the HSC-SPP website.(See the "target depth" entry in the chart.)。
Observations with multiple filters enable us to know the "color" of an object by comparing data taken at different wavelengths. For example, distant galaxies move away from us due to the expansion of the Universe, and light from the galaxies increases in wavelength or becomes redder. We call this phenomenon redshift. A hydrogen line observed at an ultraviolet wavelength from nearby galaxies increases in wavelength when observed from a galaxy 13 billion light-years away and is seen as infrared light with a longer wavelength than visible light. Multiple narrow-band filters are useful for studies of galaxies at different ages in the history of the Universe because the hydrogen lines from these galaxies are observed at different wavelengths. In the UltraDeep field, narrow-band filters with longer wavelengths are used because more distant galaxies with larger redshifts are targeted.