
How to operate the HSC Viewer
Basic operation
First, please visit the HSC Viewer website.
http://hscmap.mtk.nao.ac.jp/hscMap2_en/
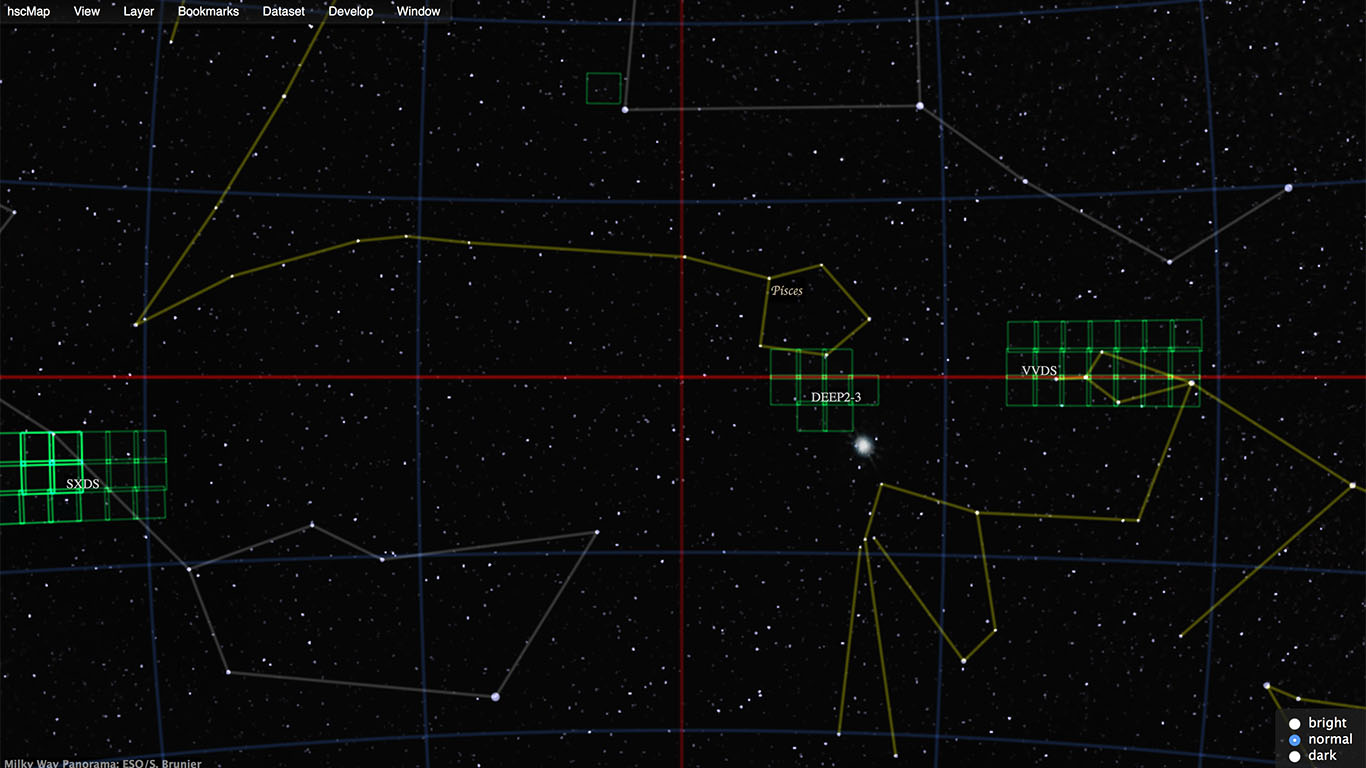
Fig. 1 The initial screen of the HSC Viewer. The many foreground dots are nearby stars listed in the Hipparcos Catalog. In this screen, autumn and winter constellations can be seen. Right ascension (celestial longitude) lines and declination (celestial latitude) lines are also displayed. The vertical red line corresponds to right ascension (RA) = 0 h 0 m 0 s and the horizontal red line corresponds to declination (Dec) = 0°. The menu bar is at the top of the screen.
HSC data is hiding inside of the green squares. We call these squares tracts. A tract is a data processing unit. The size is 1.7 degree × 1.7 degree, which is slightly bigger than the field of view of HSC (1.5-degree diameter).
Let's zoom into tracts with your mouse or touchpad. The zoom in area will be centered around the cursor. For example, place your cursor in the DEEP2-3 field with a row of tracts, and start zooming in.
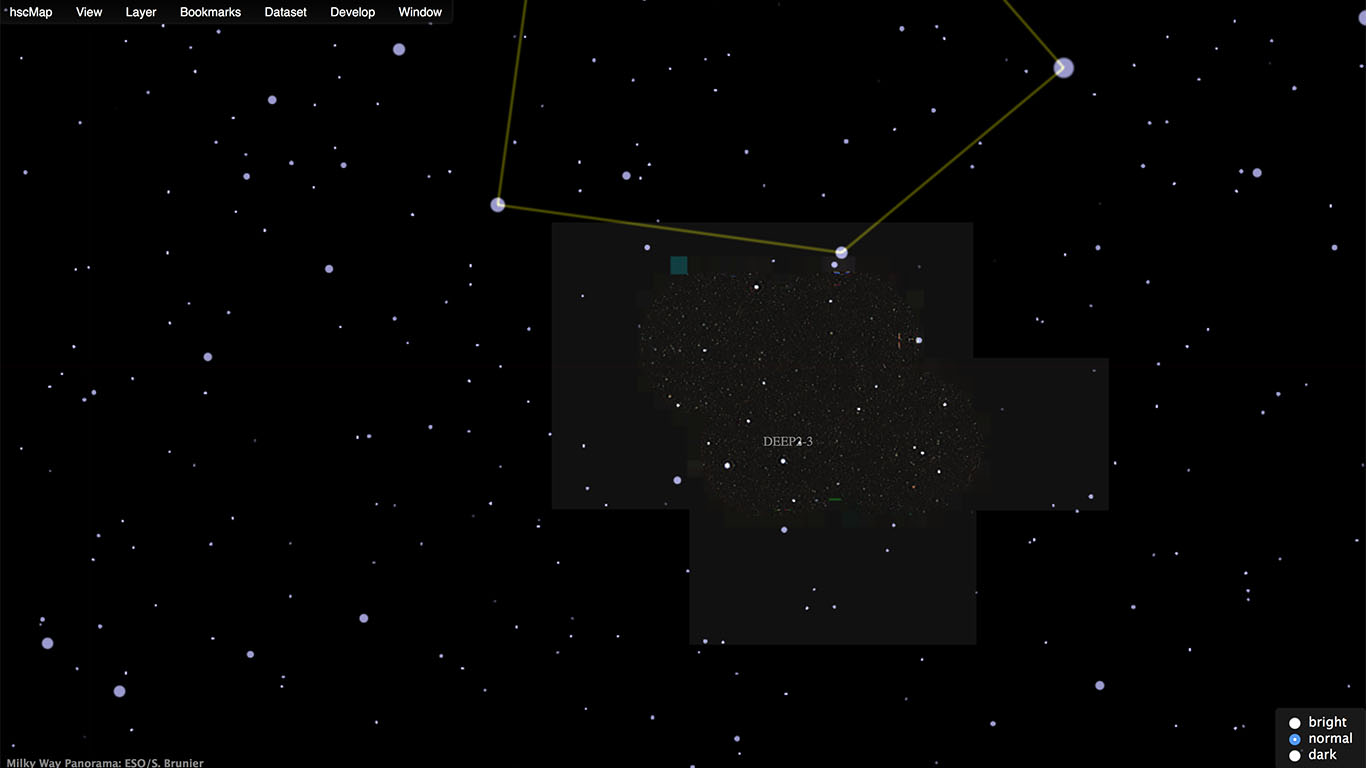
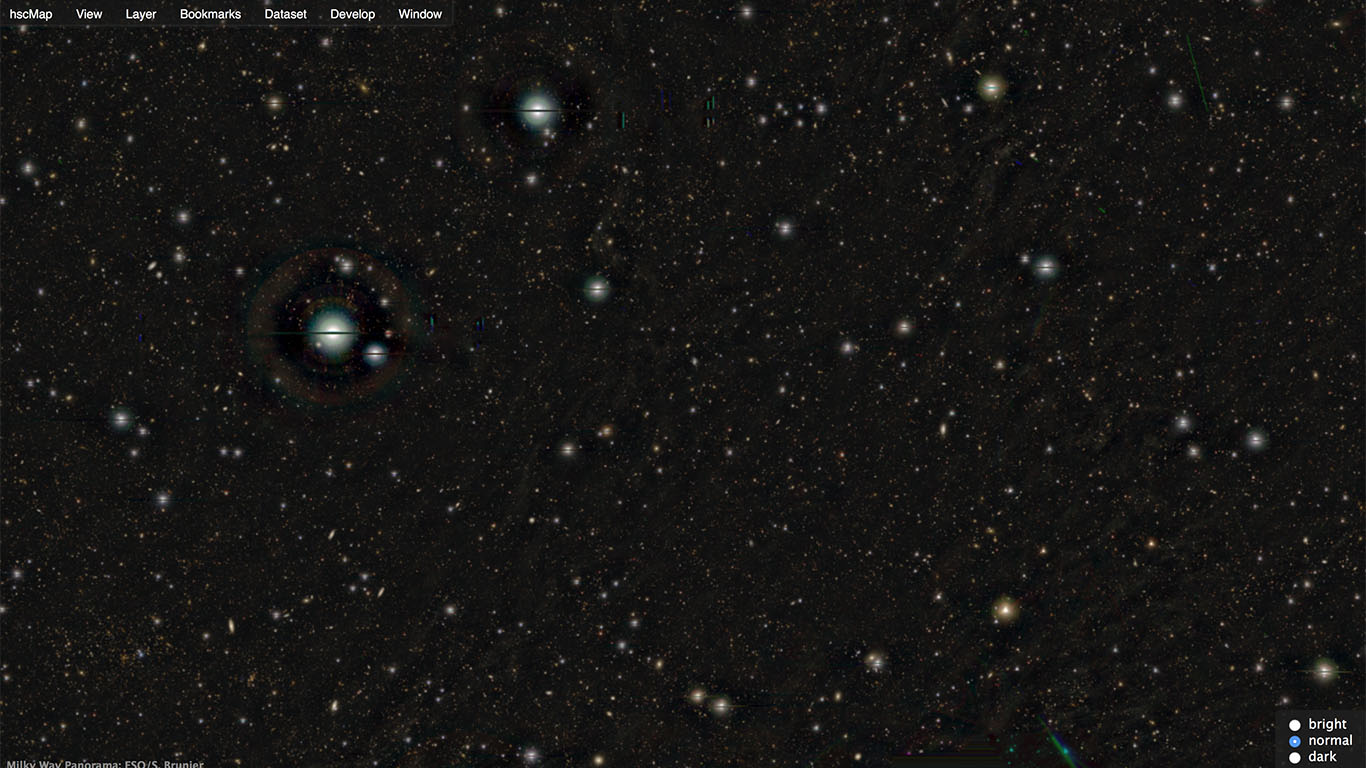
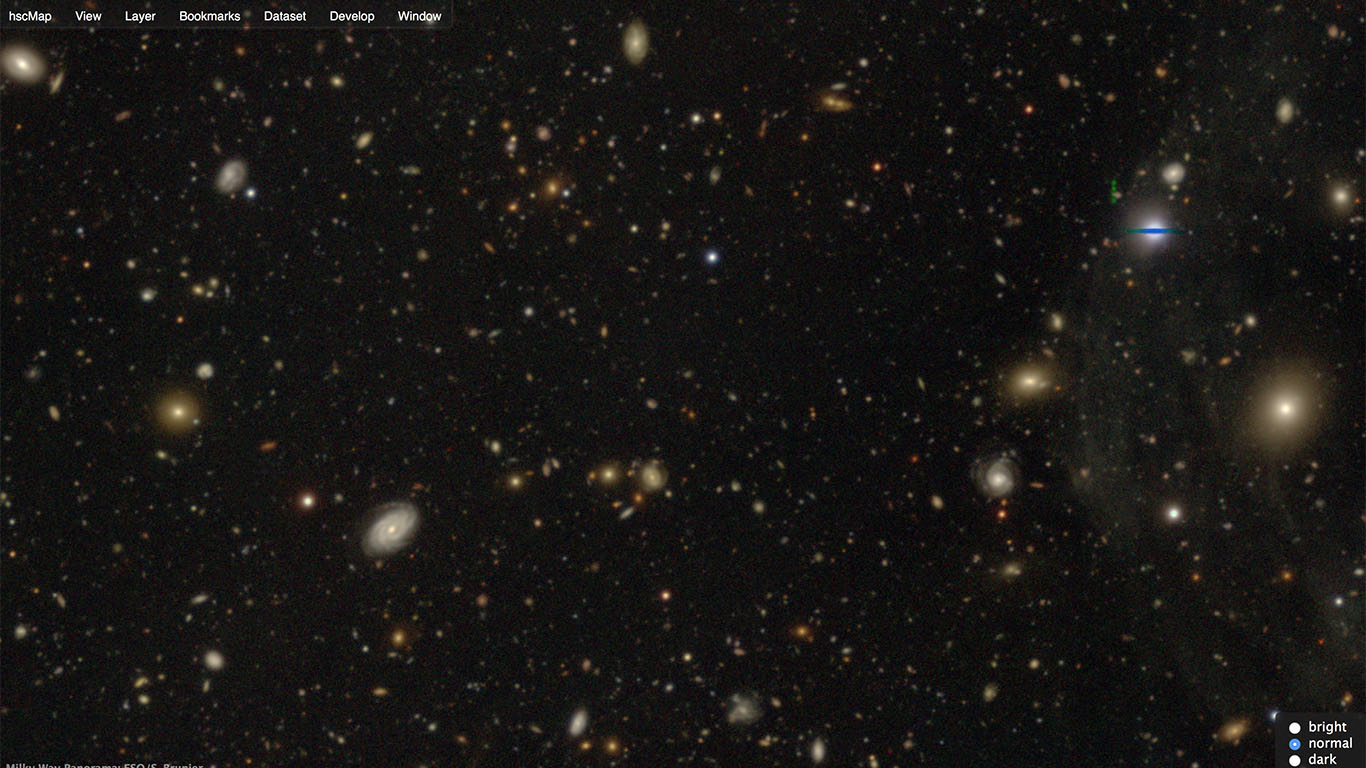
Fig. 2 A zoomed-in view of the DEEP2-3 field. When you start zooming into this field, the green squares disappear, and an HSC image appears (top). If you keep zooming in, thousands of tiny points of light start to gush out (middle). Each dot corresponds to one galaxy with hundreds of billions of stars. Galaxies which appear larger and brighter are thought to be closer to us, and smaller and fainter galaxies are thought to be farther from us. All bright objects with an extended straight line are nearby stars in our Milky Way Galaxy. (See the section titled "Real? Spurious? Strange Features in Images" for more details.)
If you keep zooming deeper into the field, fainter galaxies appear (bottom). At this scale, you can see a clear difference in the shapes of the galaxies: face-on spiral galaxies, tilted galaxies, and elliptical galaxies. You also see a variety of colors of galaxies.
Adjusting image brightness
You can adjust the brightness (light-dark ratio) of HSC images by selecting the buttons "bright", "normal", or "dark" in the lower right corner.
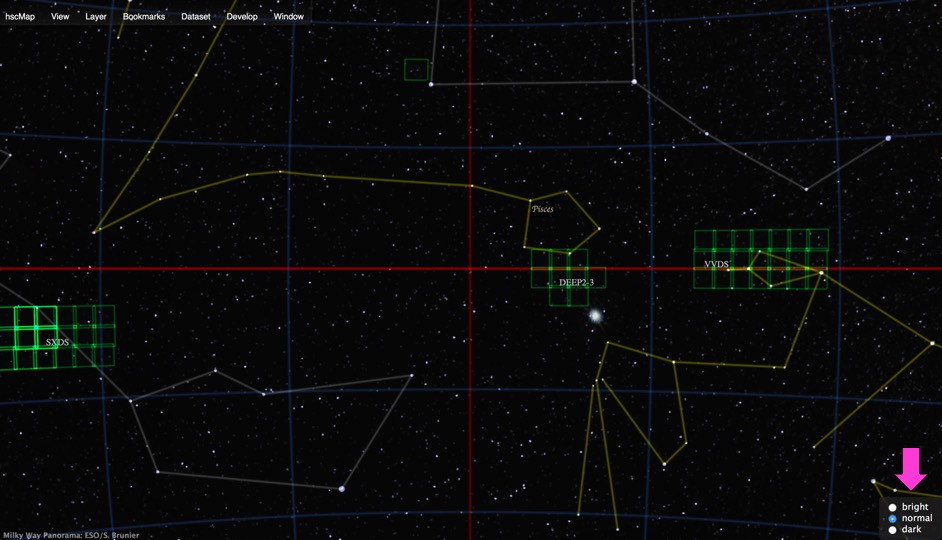
Fig. 3 Buttons for brightness adjustment. Please open the SPP Color Mixer window for more detailed adjustments.
Real? Spurious? Strange features in images
The HSC Viewer shows observational data as produced. The data may contain spurious features or fast-moving objects like those seen in the images below.
Around bright stars (spurious features)
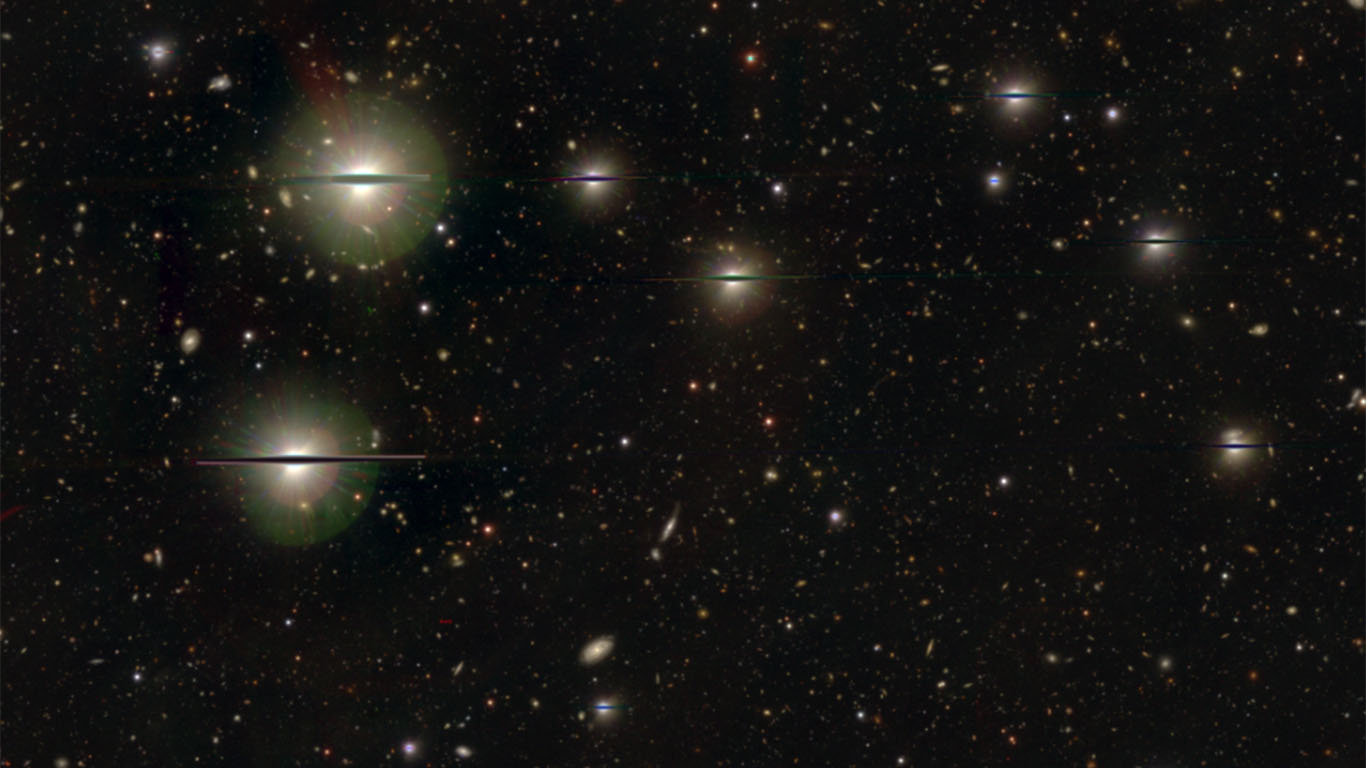

Fig. 4 (left) The horizontal straight lines on the bright stars are spurious features. These lines appear when strong light from a star spills out into adjacent CCD pixels. Many pixels, "buckets" to collect the light raining down from the heavens, are distributed in an array. A long exposure to collect more light from faint galaxies collects too much light from nearby, bright stars in our Milky Way Galaxy, and the light spills out into adjacent pixels.
(right) Multiple arc features are seen around the bright star. These features, called "ghosts," are caused by multiple reflections from the surfaces of the lenses in the camera. HSC uses a "wide spectral range anti-reflective coating" to increase light transmittance and minimizes ghosts. However, its transmittance is not 100 %, the ghosts appear around bright stars. Like in this image, ghosts display rainbow colors because ghosts at different wavelengths appear at different locations on the CCD pixels.
Artificial satellites and asteroids (real, fast-moving objects)
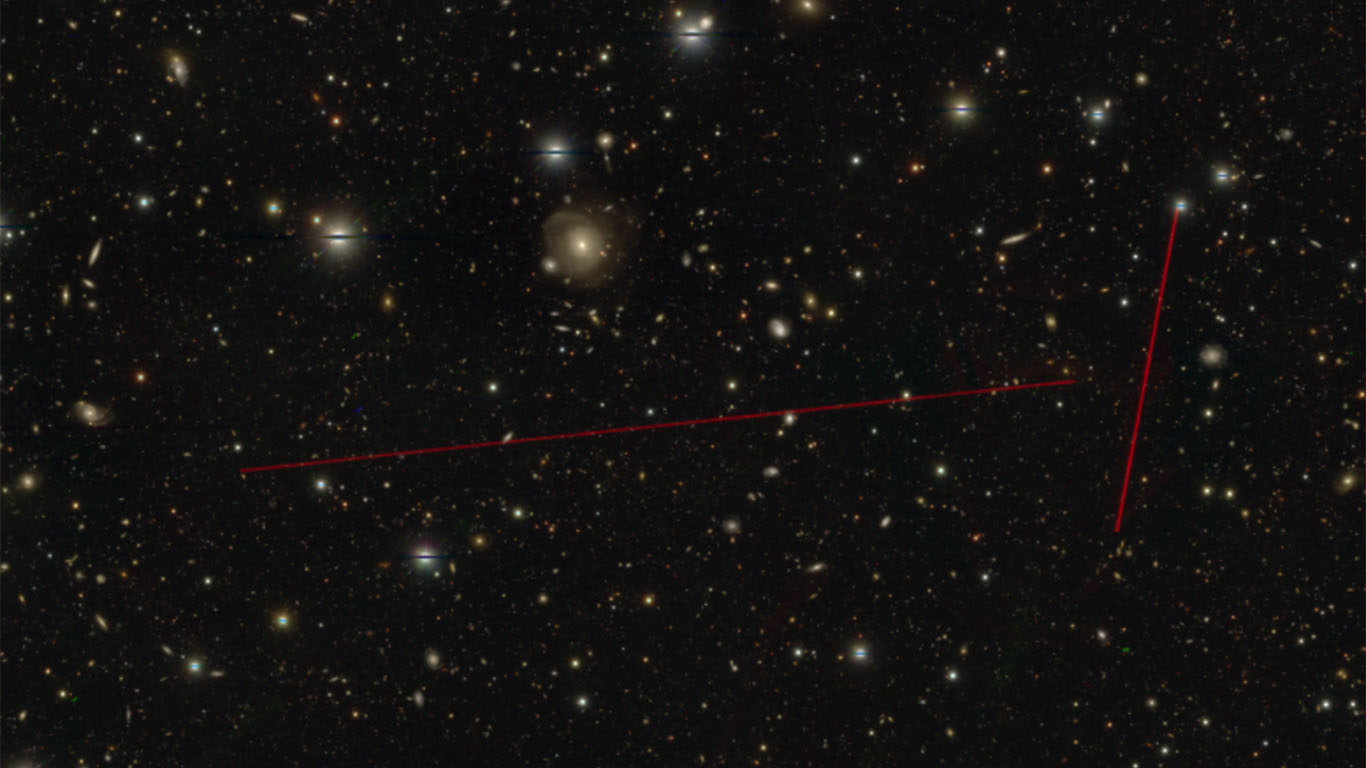
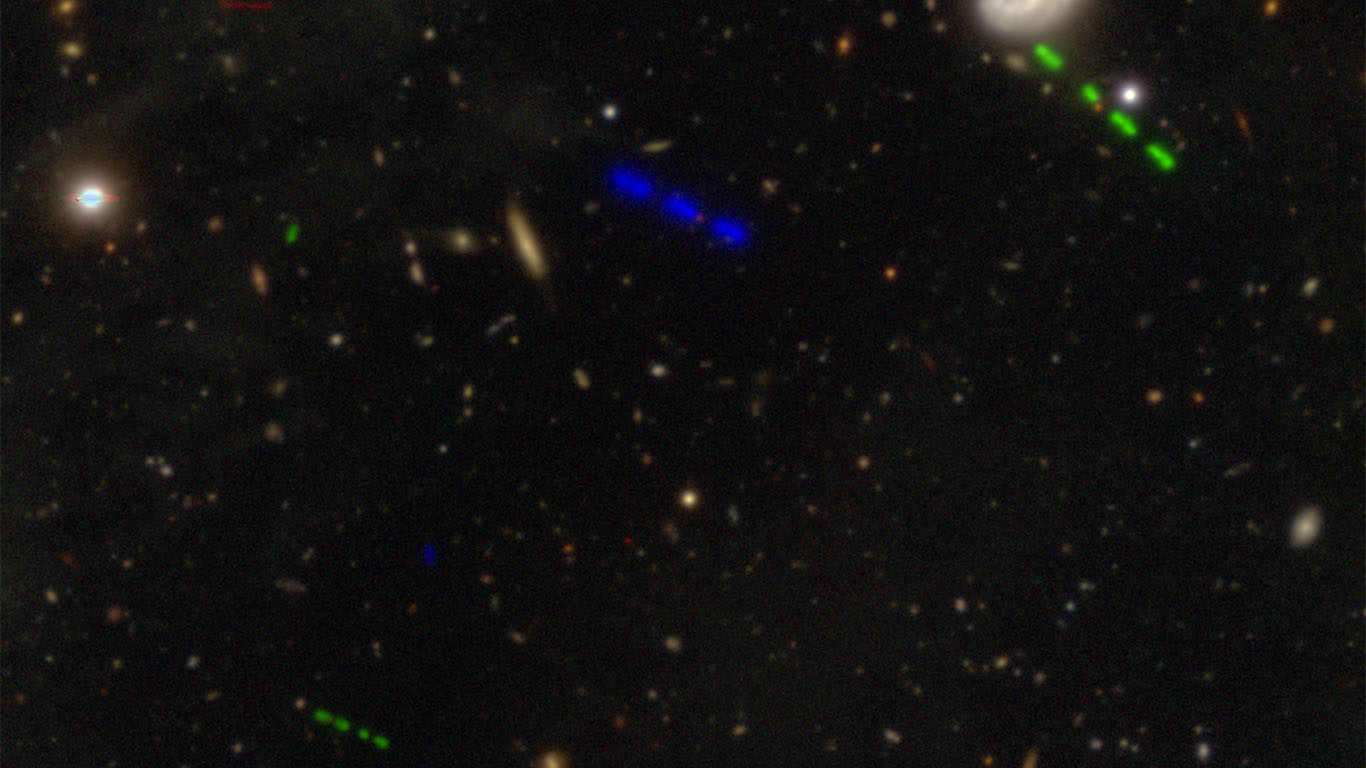
Fig. 5 (left) Straight red lines are seen. Artificial satellites crossed the field of view while taking the i-band image (shown in red).
(right) Asteroids (or similar Solar System objects) crossed the field of view. Asteroids change their positions with time. Asteroids move quickly, leaving dashed line trails during observations at r-band (shown in green) and at g-band (in blue) in this example. This image was created by adding multiple images at the same wavelength band*). For example, the blue trace of an asteroid (at g-band) is split into three short lines. It means that three images were taken and then added together. The breaks between the lines are breaks between the exposures.
*) A long exposure reduces background noise, enabling us to see faint objects. Long exposures also increase the risk of sky conditions changing or of light overflowing to adjacent CCD pixels. For this reason, rather than a single long exposure, multiple shorter exposures are taken and then added together to reduce background noise.
Edge of observation area (spurious features)
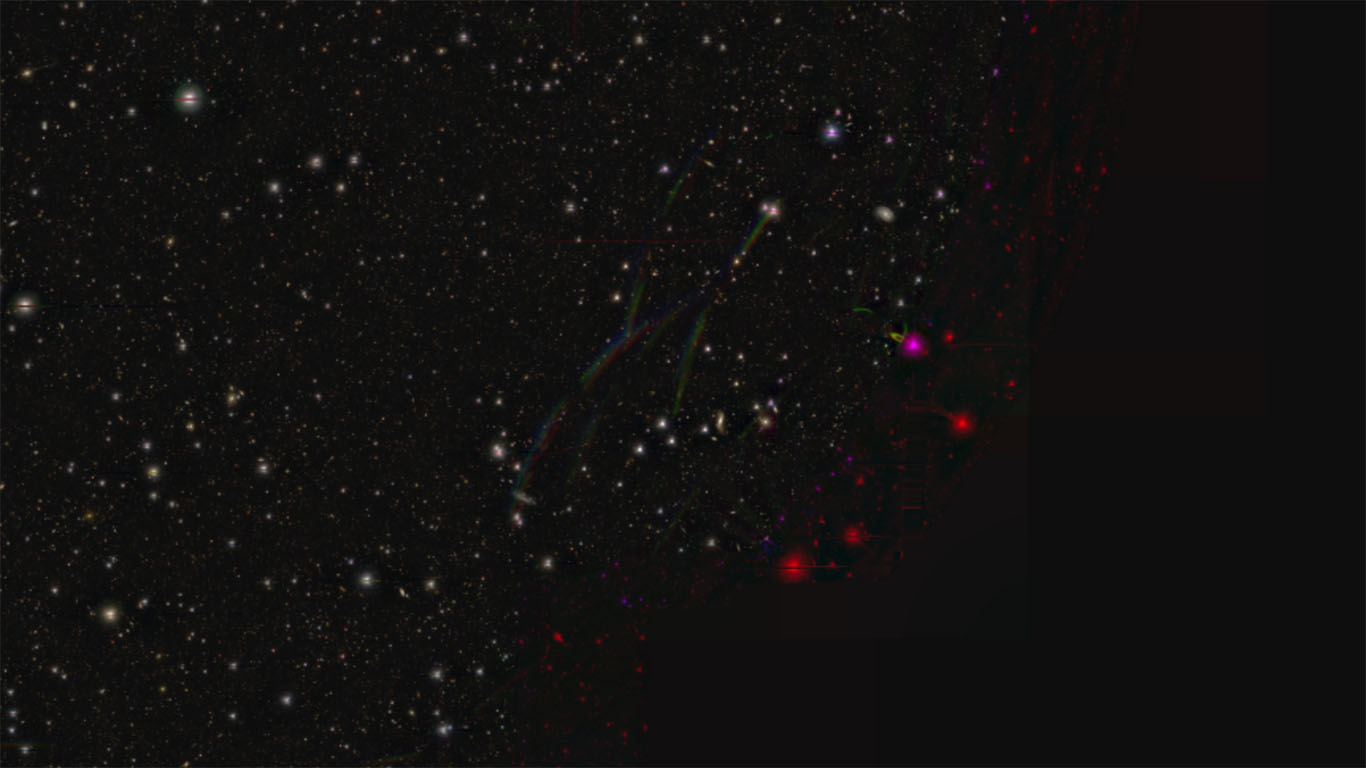
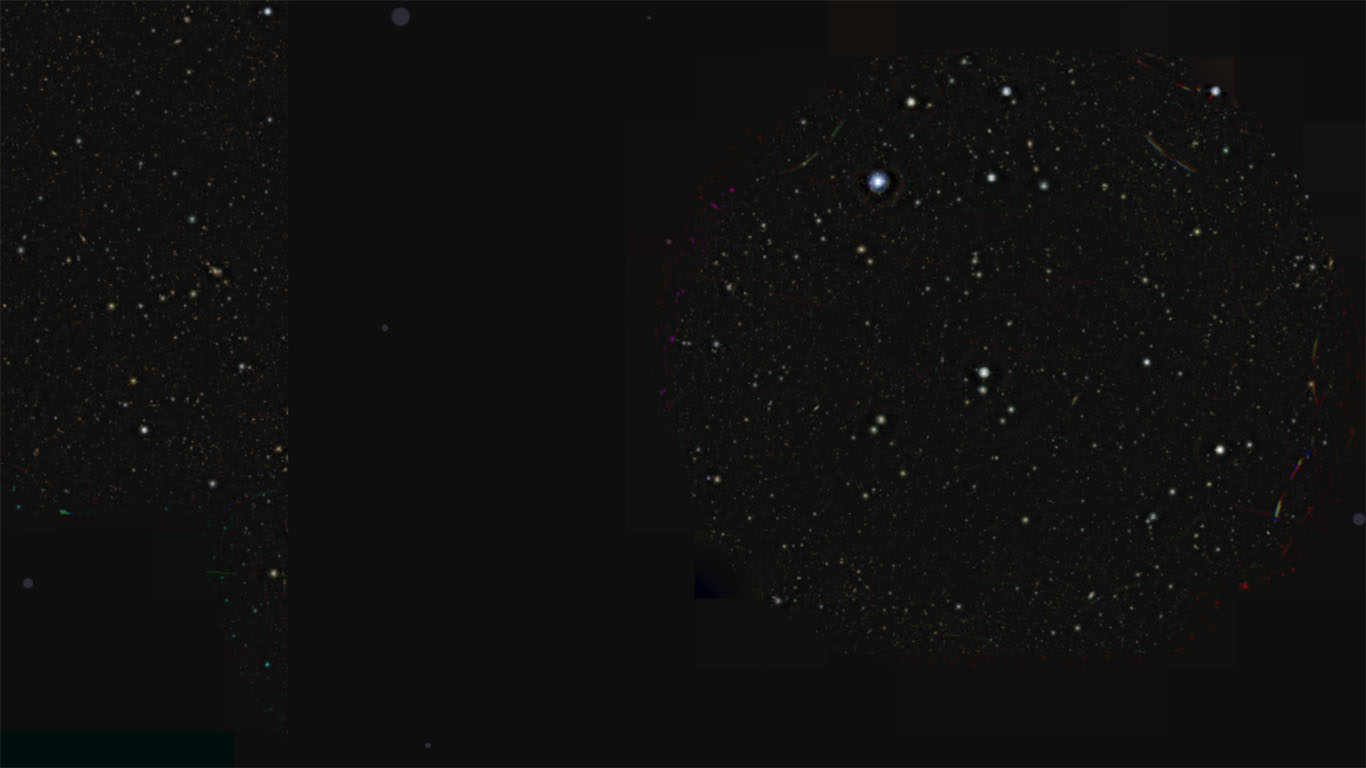
Fig. 6 The HSC Viewer shows false-color composite images of three different wavelength bands. At the edges of some observation areas, not all three data sets exist. Also, in the first data set, not all areas have been observed yet.
(left) Red features at the right edge have i-band data only. At the edge of the field of view, multiple arc-shape ghosts in rainbow colors are frequently seen.
(right) The blank area has not been observed yet.
CCD readout error (spurious features)
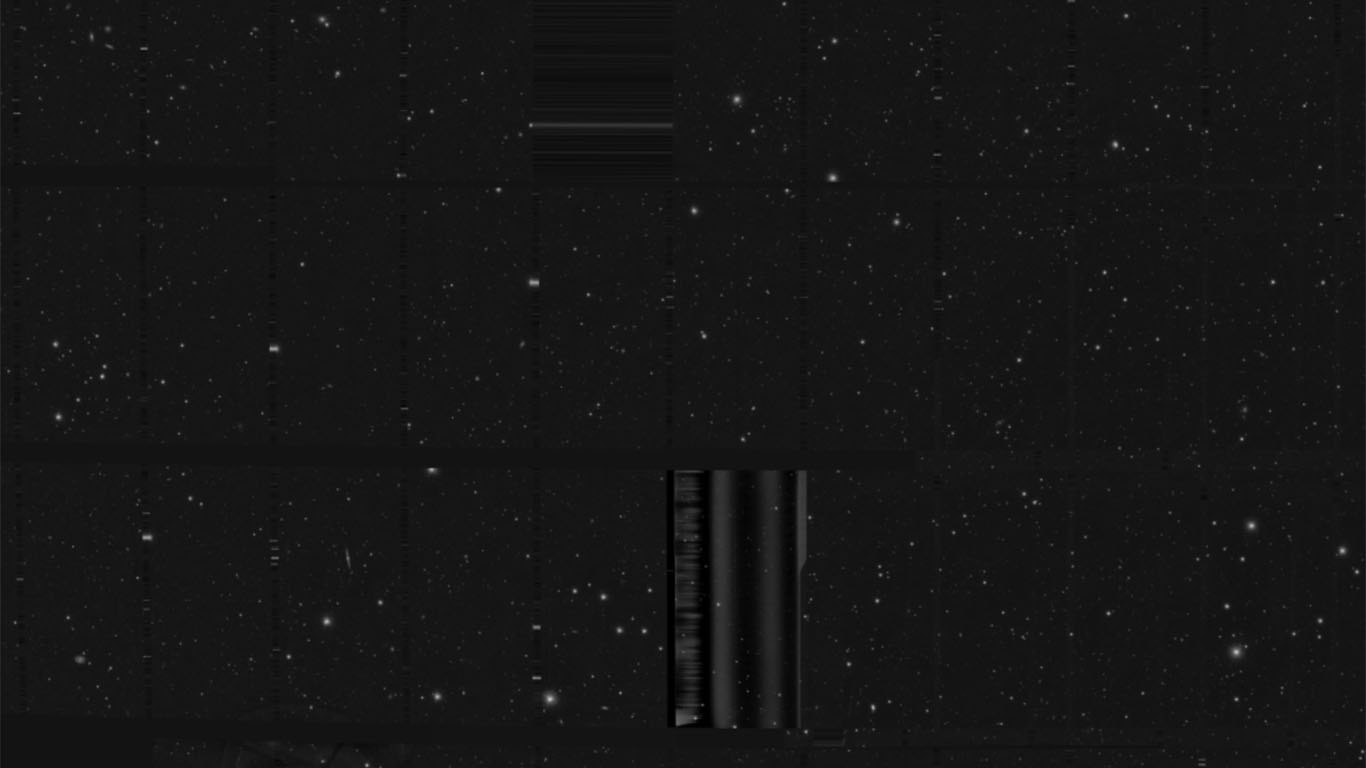
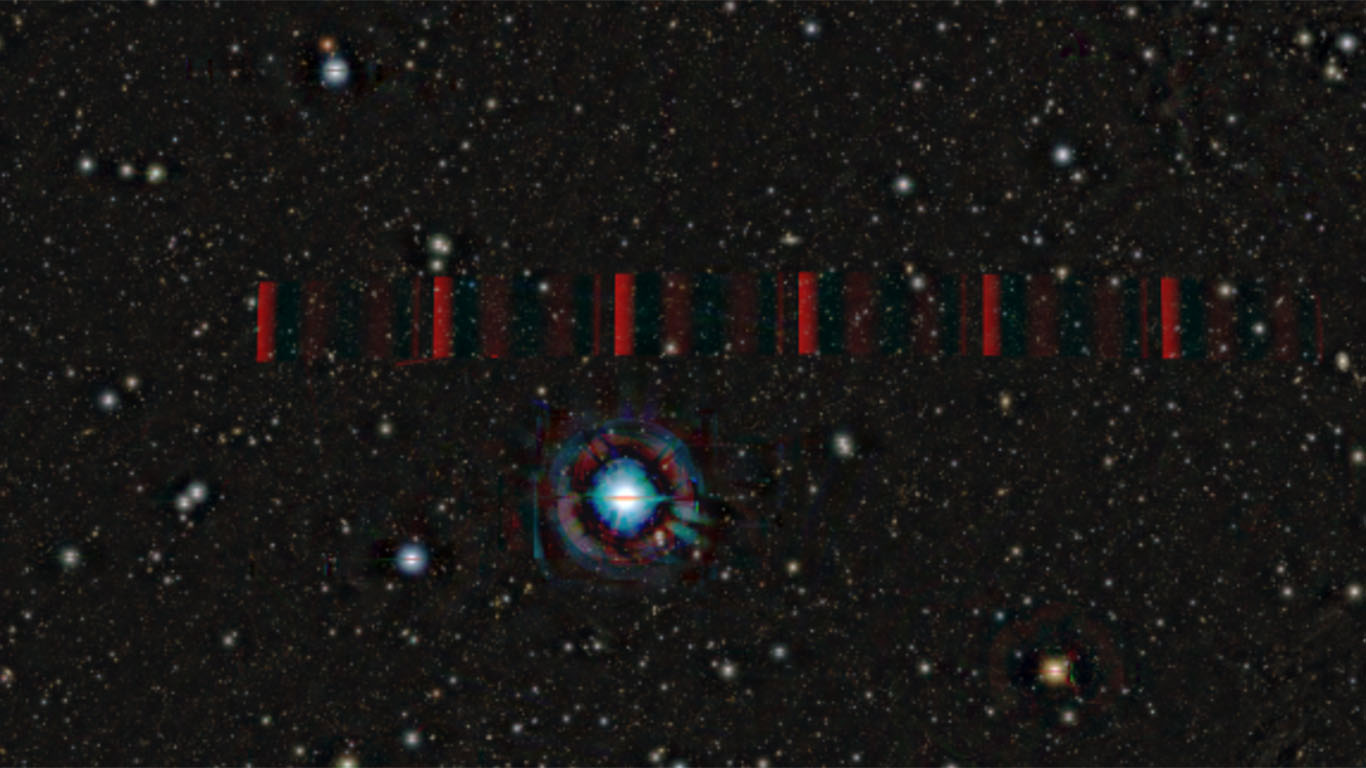
Fig. 7 CCD’s consists of a 2-dimensional array of pixels, which converts the intensity of light detected at each pixel into an electrical signal to transfer the data. When a pixel readout error occurs, parallel lines of light are seen.
(left) The parallel lines seen in the lower-middle area are due to a CCD readout error. This area was observed at z-band only, and the image is shown in grayscale. (This image shows the infrared follow-up observation data of the source of gravitational wave GW170817 detected on August 17, 2017. See the Subaru Telescope press releaseをfor more details.
(right) A CCD readout error which occurred during i-band observation is seen as red parallel lines. Below the lines, ghosts around the bright star are also seen. (See Fig. 4 for more information about ghosts.)
Cosmic gas and dust in the Milky Way Galaxy (real features)
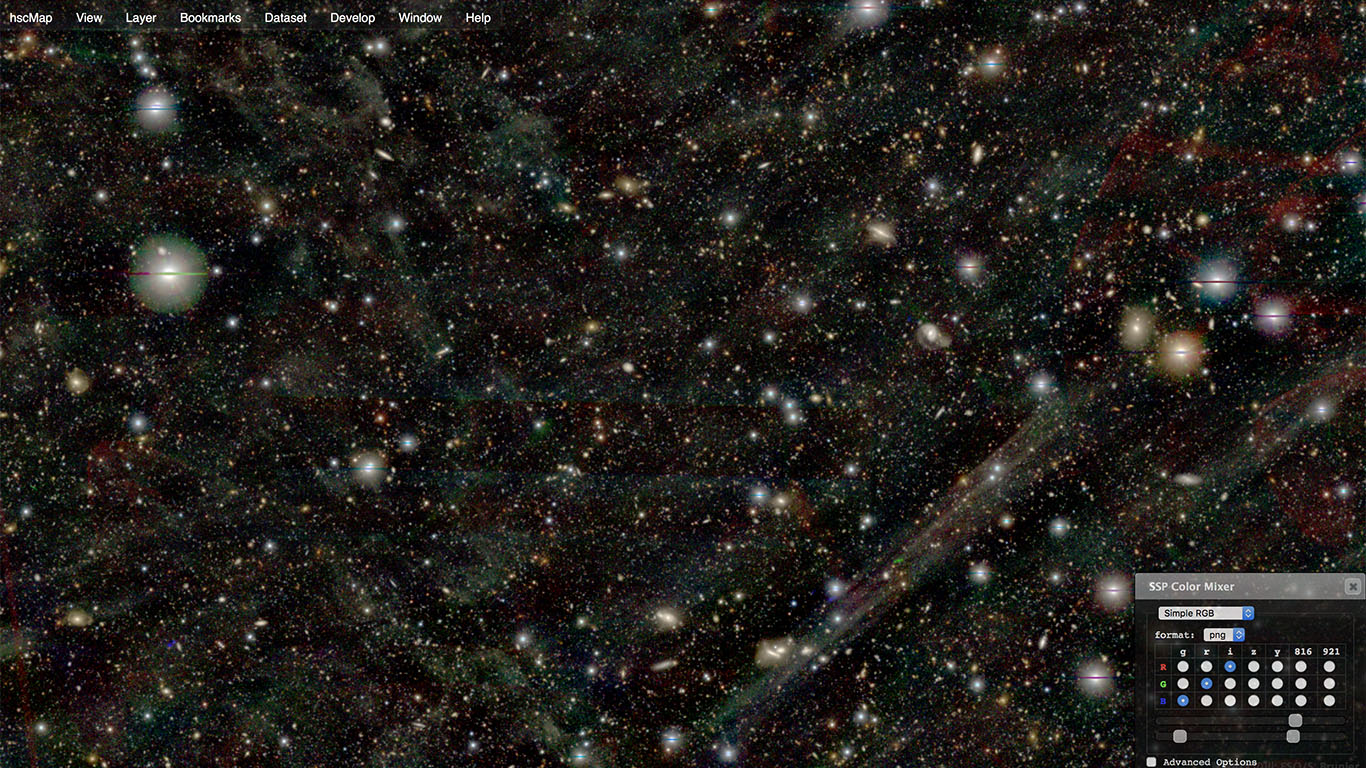
Fig. 8 A faint pattern like a cirrus cloud is sometimes seen in the sky. Like in this image, this feature is clearly seen when you brighten the display with the first bar in the SSP Color Mixer window (move the knob to the right), or you select the "bright" button in the lower right corner. This feature, called a "cirrus," is light scattered by cosmic gas and dust in our Milky Way Galaxy. All HSC-SSP fields are far from the Milky Way and have little influence from Milky Way objects. The VVDS field is closer to the Milky Way, and this kind of cirrus feature is frequently seen.