01Bargain Observations “Multi Object Slits Spectroscopy”
Spectroscopic analysis is a promising means of investigating the physical state of celestial objects. Astrophysicists analyze the light from objects passing through optical devices, such as a prism or grating, and study the intensity distribution along wavelengths. In short, spectroscopy allows us to see the colors of objects in detail. Spectroscopy analyzes only the light though a slit (or slits) put on the focal plane of a telescope.
Spectroscopic observations have a history of over 100 years. Although the aims and the principles have not changed, instruments have been developing. An observational procedure applied from long ago is to take a spectrum by bringing the light of an object into a fixed narrow slit by controlling the telescope pointing. Astrophysicists find this method inconvenient, since they can analyze only the light coming through the slit and cannot study other lights in the field of view (FOV) of the telescope. When there are lots of interesting objects in the FOV, it seems wasteful not to observe them.
A wiser method, multi object spectroscopy, has been developed and is getting more and more popular. This enables us to obtain spectra of lots of objects at once. FOCAS (Faint Object Camera and Spectrograph) on Subaru Telescope adopted a Multi-slit method, one technique of multi object spectroscopy. Other techniques have been developed to take spectra in several areas of the FOV using fiber optics or lens array.
: Activity of the irregular galaxy M82
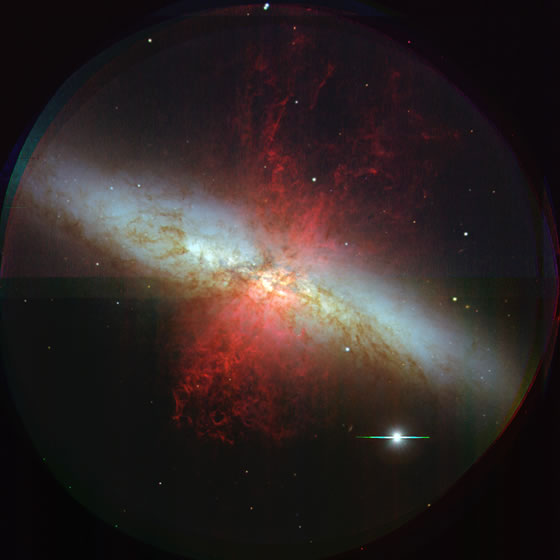
Image 1: Color composite image of irregular galaxy M82.
Let’s look at an example that shows the capability of multi-object spectroscopy. Here we look at an irregular galaxy, M82.
Image 1 is a color composite image obtained from observations with several band filters. High temperature gas seems to be ejected from the galaxy due to massive star formation and supernova explosions. A research team took spectra of several areas to investigate how activities differ from region to region. Image 2a shows the direct image in a band filter by FOCAS. Observers selected which areas were to be observed spectroscopically, and 26 regions were chosen in this case. A made-to-order carbon fiber sheet with 26 slits (Image 2b) was prepared using a laser processor machine. The sheet was installed into FOCAS for the MOS observation. Image 2c shows many spectra observed simultaneously. Each horizontal streak is the spectrum of the target. Numbers in images 2b and 2c indicate which slit corresponds to the obtained spectrum for three slits, for example.
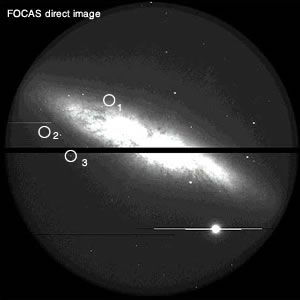
Image 2(a): FOCAS direct image
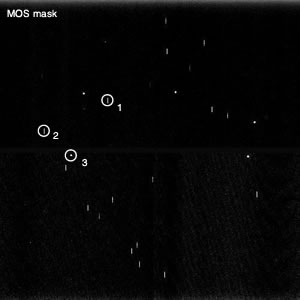
Image 2(b): MOS mask
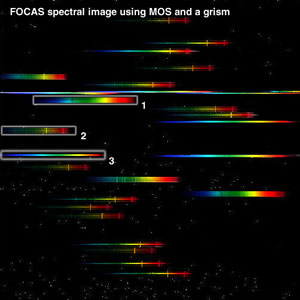
Image 2(c): FOCAS spectral image using MOS and grism
We note that the real spectral data appear in black and white. Image 2c is colored according to wavelength to help understanding. As image 2c shows, wavelengths correlate with positions of detector in a spectroscopic observation.