04Analysis of Spectra in Astrophysics --- Visiting the Old, Learning of the New
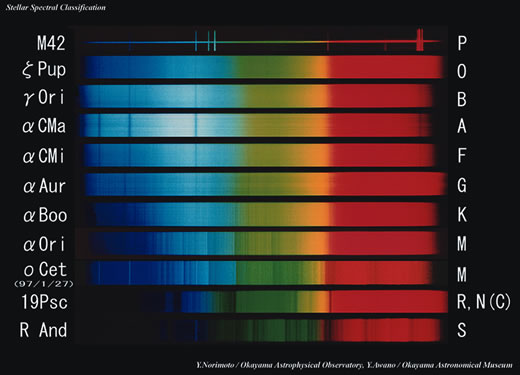
Image 1: Typical spectra for spectral types. Object names and spectral types are indicated on the left and the right sides, respectively. The types from O to M correspond to a sequence of objects' temperature and the O type is the hottest. R, N, and S types are categorized differently because their chemical compositions are found to be peculiar. The spectral were taken by the 188cm telescope at Okayama Astrophysical Observatory. This figure was taken from a book titled "Cosmic Spectral Museum" (Yumi Awano, et al. Shokabo Publishing Co., Ltd)
Spectroscopic observations introduced in the 19th century completely changed the coverage of Astronomy and Astrophysics. Up to that time, astronomers had tried to understand the universe by measuring the positions of celestial objects and studying their shapes. The advent of spectral analysis revealed to us the materials which make up stars including the Sun. Thanks to spectroscopic observations, humankind learned of the expansion of the universe for the first time.
Roughly speaking, spectroscopic observations give us two kinds of information: information concerning the chemical composition and the motion of objects. First, emission and absorption lines correspond to specific atoms and molecules. Therefore, the intensity of such lines tells us what kinds and what quantity of atoms and molecules exist in a given object. In addition to the chemical composition, spectra contain information about the temperature and the pressure of the object. Second, the so-called Doppler Effect is used to derive the motion of an object. When the object goes away from an observer, the wavelength of received light is longer. Conversely, the wavelength is shorter when the object approaches. This means that we can measure the motion of an object by analyzing the shift of a spectral line. The motion derived in this way is a velocity in the direction of the observer's line of sight and is called radial velocity.
Spectral Type and Brown Dwarves
Spectral type classification of stars was one of the most active research fields in the first part of the 20th century. A star appears as a point in the sky and cannot be classified based on its shape. However, spectroscopic observations revealed a variety of types of stars. Stellar spectra were characterized by the absorption lines due to various elements such as hydrogen. At first, stars were empirically categorized according to the spectral features and the types were named alphabetically. Further studies uncovered the meaning of the spectral differences.
Image 1 shows the spectral data of stars as representatives of the spectral types in this classification. We now know that this sequence corresponds to the temperature of the stellar atmosphere.
At the end of the 20th century, researchers found stars of lower temperature than that of M type stars which were classified as stars of the lowest atmospheric temperature. They are objects which cannot fuse hydrogen to extract energy and are called brown dwarves. Similar to the other stars, the brown dwarves were also classified based on spectral features well-correlated with stellar temperature. Today, the spectral classifications of L-type and T-type have been established. We note that there also exist subtypes called L1, L2, L3, and so on.
The brown dwarves have low temperatures and they are very faint in optical. Therefore, the classification is based on features appearing in infrared such as water vapor, methane, and so on. The spectral classification of stars has a long history and has been developing with the discovery of new types of objects.
Radial Velocity of Stars and Extrasolar Planets
Image 2 shows the relation between the radial velocity of an object (Jupiter in this case) and spectral lines. Jupiter's rotation period is a little bit less than 10 hours. This is very fast and the area near the equator rotates at 12 km per second. The lines in Jupiter's spectra are Doppler shifted toward the blue (shorter wavelength) and toward the red (longer wavelength) on the opposite side of the planet equator.
It is not exaggeration to say that the Doppler shift method to measure radial velocity is used in every field of Astronomy. Accuracy has been getting higher and higher. This method contributed to discovery of extra-solar planets (exoplanets) at the end of the 20th century. Today, other methods are applied to discover and investigate planets revolving around stars other than the Sun. Still, the Doppler shift method is the most effective way to study exoplanets. By utilizing the Doppler shift, observers detect slight movements of a star by the gravity of a planet revolving around the star. The revolution period tells us the existence of a planet and enables us to estimate the planet's orbital period. The accuracy of the radial velocity measurement is continually increasing, and now researchers can measure velocity change of only one meter per second.
Spectral observations can be thought of as classical. However, the advent of new instruments and improvement of accuracy have been producing research at the forefront of Astronomy.
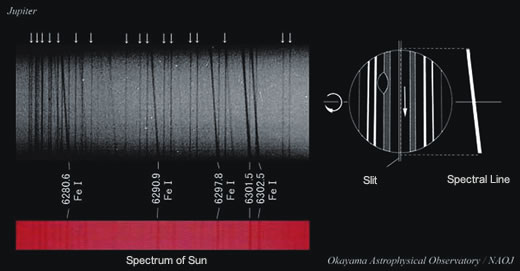
Image 2: Spectrum of Jupiter. The upper and the lower correspond to the side approaching and going away to the Earth, respectively.