06Measurement of Solar Magnetic Field
The solar magnetic field causes structures appearing on the Sun's surface such as sunspots and various activities occurring in the solar atmosphere. How do you think we knew of the existence of the solar magnetic field? Researchers applied "the Zeeman effect", the splitting of a spectral line into several components in a magnetic field. When we observe a solar spectrum, we find that a single spectral line outside a sunspot splits into three components inside the sunspot. The separation between the components along the wavelength is proportional to the strength of the magnetic field. Thus, by the means of the Zeeman effect, astronomers measure the strength of the solar magnetic field and find it to be as strong as 3000 gauss. The magnetic field of the Sun is far stronger than geomagnetic field which is less than 1 gauss.
The Solar Optical Telescope on board Hinode (Solar-B) aims to measure the magnetic field with high accuracy. In addition to the strength, the direction (the vector) of the magnetic field is also important. To know the direction, the researchers perform spectro-polarimetry which measures weak polarization using the Zeeman effect. Examining spectral lines closely, they derive the distribution of solar magnetic field vectors.
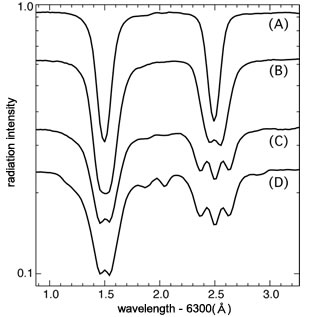
Image 1: Spectra of a sunspot observed by Hinode's Solar Optical Telescope. The labels from (A) to (D) correspond to the locations indicated in Image 2. A single absorption line in the spectrum (A) splits into three components in the spectrum (D) by strong magnetic field (the Zeeman effect). Both absorption lines (at wavelengths of around 6301.5 angstrom and around 6302.5 angstrom) are iron lines. Since the absorption line of longer wavelength is more sensitive to the Zeeman effect, the three components appear more clearly for this absorption line.
: Twisting of the Sunspots and Solar Flares
The distribution of the magnetic vectors on the solar surface tells us how much energy is accumulated in the solar atmosphere. The accumulated magnetic energy will eventually be released and result in gigantic solar flares. Figure 2 shows a sunspot observed in December 2006. In this sunspot, umbrae with opposite polarities exist side-by-side in a penumbra. The two umbrae are connected by twisted magnetic field lines, which resembles a typhoon. This feature is a signature of accumulation of enormous magnetic energy. In fact, one day after the observation, we detected a huge solar flare.
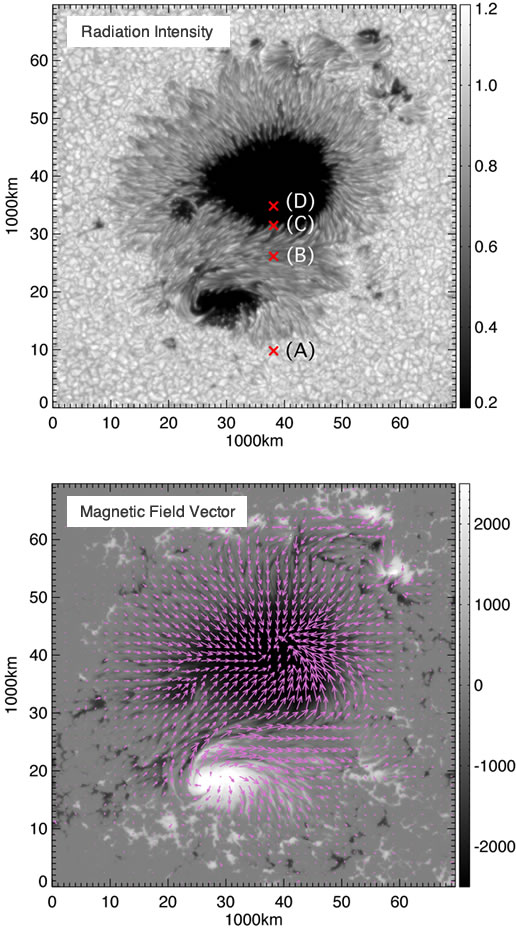
Image2 : The Upper panel shows the radiation intensity observed by Hinode's Solar Optical Telescope in December 2006. The lower panel shows the distribution of magnetic field vector derived by using the Zeeman effect. The marked points from (A) to (D) indicate locations where the spectra in Image 1 were observed.