03Adaptive Optics, Powerful in Spectroscopic Observations, as Well
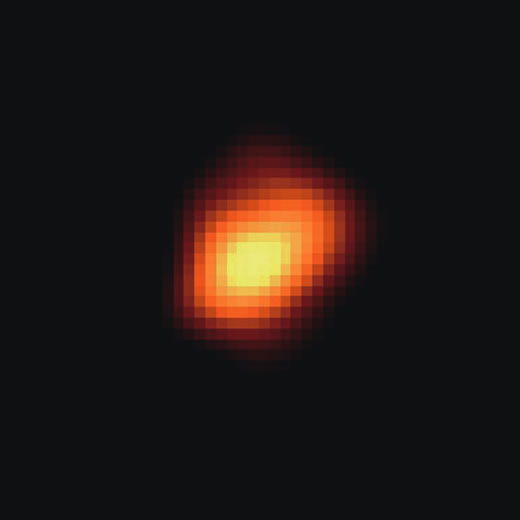
Image 1: A variable star Mira taken with the Hubble Space Telescope. This star is in the final evolutionary stage of a red giant star. The image shows that the stellar shape is not spherical, but distorted.
A star far away from us is generally treated as a point source. However, this is not the case, thanks to the advent of satellite telescopes outside Earth's atmosphere and adaptive optics (AO) which compensate for turbulence in the Earth's atmosphere. Image 1 shows that these new instruments enable us to measure the extent of an evolved red giant star.
AO can compensate for blurring due to atmospheric turbulence and recover a sharp image on-time. Light from a star is disturbed by the Earth's atmosphere and the atmospheric conditions change rapidly. The AO system uses a sensor to measure the disturbance of a bright guide star near the target object and a deformable mirror to correct the disturbance in a flash. This operation is performed one thousand times in a second. In this way, researchers can obtain a sharp image of the target.
An image as sharp as the theoretical limit of the telescope permits us to investigate the relation between wavelength and the size of a star. You may sometimes hear that the diameter of the Sun is 696000 km or the apparent diameter of a star is 1 milli-arcsecond for example. In fact, these numbers depend on wavelengths. Because we can see through to the deep atmosphere, the size of a star tends to be small when we observe it in wavelength range which is not so much affected by the stellar atmospheric absorption. On the other hand, a star surrounded by high temperature molecular gas looks large at the wavelength that the molecular gas emits.
The AO system is generally thought of as a system to obtain sharp images. In addition to this usage, the AO system also provides spectral data of high sensitivity. Moreover, it enables us to study the relation between stellar sizes and observing wavelengths. Spectral data with the AO system also allows us to investigate properties of a star picked out of an area crowded with lots of stars or binary stars close to each other.
: Measurement extension of a red giant star, Mira
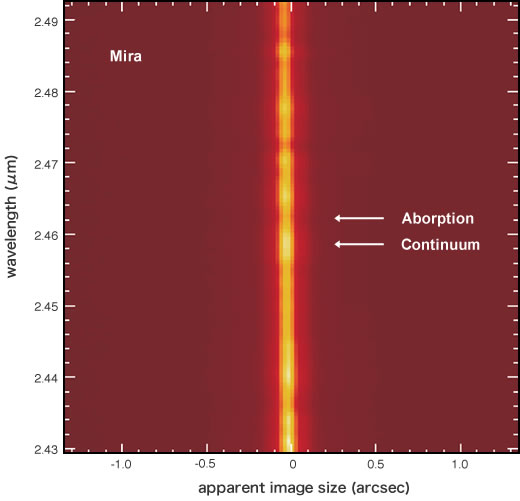
Image 2: Spectrum of Mira. Thanks to the AO system, the size of the stellar image is as small as 0.1 arcsec. You may see several spots (reddish areas) where the light intensity is weak in the spectrum. These spots correspond to molecular absorption.
Image 2 shows the spectrum of a red giant star, Mira, where the vertical and horizontal axes correspond to wavelength and the size of stellar image, respectively. The yellow strip corresponds to an area where the intensity of stellar light is strong. We can see some faint parts in the strip due to molecular absorption. Image 3 demonstrates the relation between the size of the stellar image and observed wavelength. The apparent stellar size is larger at the wavelength where the spectral intensity is weaker. For example, there is an absorption band due to carbon monoxide at around 2.3 micrometers. Like a mirror image of the shape of the spectrum, we can see that the apparent stellar size becomes bigger. Another example is the effect of the absorption band of water vapor, which appears at the wavelength longer than 2.45 micrometers. We observe the obviously enlarged stellar image. The apparent stellar image depends not only on absorption but also molecular species resulting in absorption.
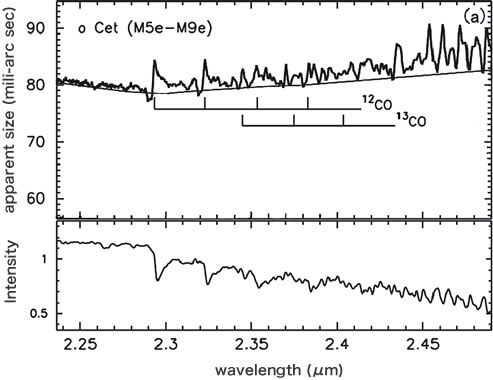
Image 3: You may see spectrum features of Mira affected by absorption of carbon monoxide and water vapors in Mira's spectrum (lower panel) correspond to observed stellar size at a given wavelength (upper panel). The image size presented here is enlarged by some factors due to the diffraction by the telescope. Hence, the actual stellar size changes from 20 to 40 milli-arcsec depending on wavelength.