05Fraunhofer Lines of the Sun
When you let sunlight pass through a prism, you can see that the light is broken up into the colors of the rainbow (a spectrum). If you observe the spectrum more carefully, you will find countless dark features. These are absorption lines caused by impurities such as calcium, sodium, magnesium, iron, and so on. The chief element of the Sun is hydrogen, and the impurities in minuscule quantities absorb the light coming from the inside at specific wavelengths, resulting in the dark features.
The Fraunhofer lines are a set of famous absorption lines named after a German physicist. Fraunhofer designated the principal features with the letters A through K from longer wavelength (redder) to shorter (bluer). For example, the D line is caused by sodium, and the H and K lines are caused by calcium. Some Fraunhofer lines were known to originate in absorption in the Earth's atmosphere.
The Fraunhofer lines are, indeed, a lifeline of solar physicists. The depths of the absorption lines provide information about temperature, and the wavelength shifts of the lines tell us the motion of gas. If the Sun consisted only of pure hydrogen, there would be no absorption line. This would mean that the researchers could not study the temperature or the motion of the Sun's atmosphere. This would be the end for them. Thanks to the impurities, we can investigate the Sun in detail.
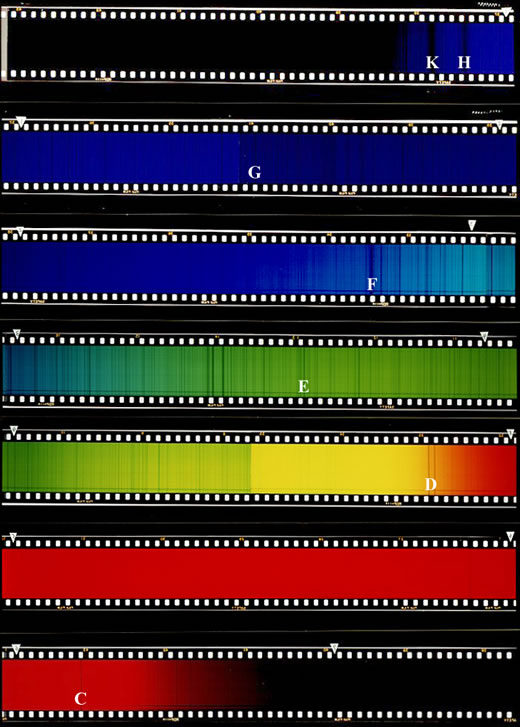
Image 1: Solar spectra observed by 25cm Cornagraph at Norikura Solar Observatory. The Fraunhofer lines (C, D, E, F, G, H,and K lines) are indicated.
: 3-D Structure of the Sun's atmosphere
A dark feature in a spectrum results from absorption of light at a given wavelength. This means a low degree of transparency of the atmosphere at this wavelength. Therefore, we can only observe the outer region of the Sun at this wavelength. We utilize this to study the atmosphere outside the region where we usually observe. The degree of the transparency of the Sun's atmosphere depends on the absorption lines. Thus, we combine several absorption lines to observe several layers and to study the 3D structure of the Sun's atmosphere.
Image 2 shows sunspots observed in the Fraunhofer lines using Hinode's solar optical telescope. The Sun's photosphere, the surface of the Sun, appears in the G band image (panel (a)), while the outer layers called chromospheres can be observed in the H (panel (b)) and C (panel (c)) bands.
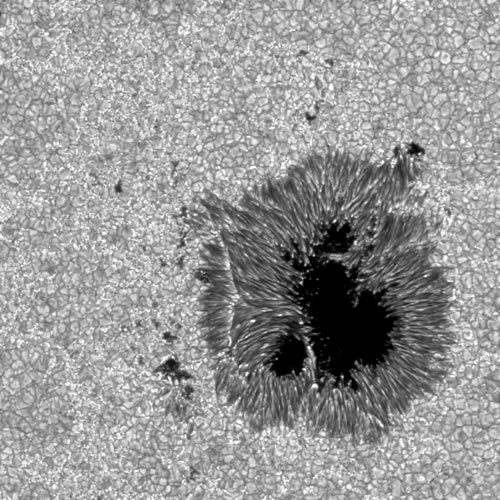
Image2a:G band image (hydrocarbon molecules)
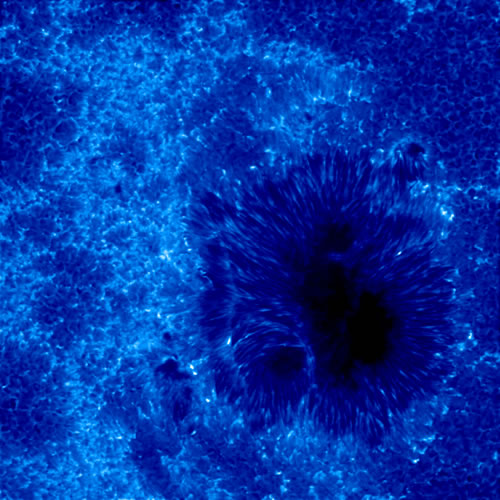
Image2b:H line (calsium)
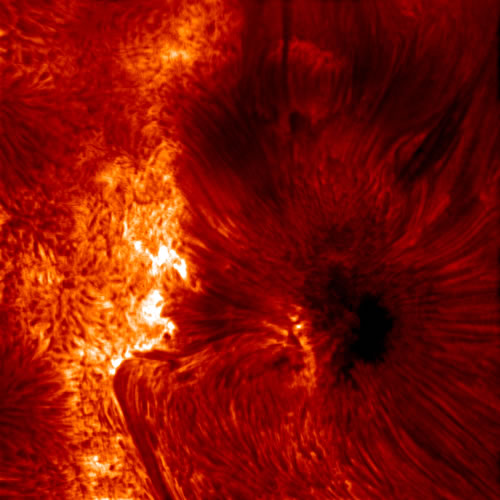
Image2c:C line (hydrogen)